River Rejuvenation: A Theoretical Understanding
Rain-fed rivers usually run dry in the months before the monsoon season. Rejuvenating a river is a complex, highly skilled and an essential process in order to sustain life and livelihoods all along its banks.
T he rivers of our country may be divided into two broad categories. Some rivers originate in the Himalayas. In addition to rainfall, these rivers also benefit from the melting of the accumulated ice cap of the mountains. The other set of rivers are entirely rain-fed, receiving water from the annual rainfall alone; in non-rainy seasons, their flow is limited to the extent of inflow of water from seepage through the soil mass of its catchment. If the rain fails, the area remains ‘thirsty’; rivers remain dry or have less water.
I will confine this article to the rejuvenation of rain-fed rivers only. There may remain possibilities of mistakes in my assumptions and analyses; this is reason enough to share it with my friends so that you contribute to rectifying mistakes and help in developing a deeper and better understanding of the rejuvenation of rivers.
M ost rivers get enough flow in the rainy season. The challenging task in the rejuvenation of a river is enhancing its flow in the dry months (from post-monsoon to the pre-monsoon months) of the year. Here, I attempt to develop an understanding of the factors that could possibly be used in planning the rejuvenation of rivers.
Let us imagine why and when rivers flow. A river cannot flow until certain conditions are met. These conditions are:
- In the rainy season (July to October), the runoff from a catchment can reach the river only when there is enough rain to fill all the ‘holes’ of the surface of the catchment area. These include all small and big water bodies (natural or human-made), embankments ponds/tanks, dams, field bunds and other intercepting surface structures. And from these intercepting points, the rate of infiltration has to be less than the rate of water available from precipitation or from water entering through any other external sources.
- During the rainy season, it may rain enough to balance the water ‘lost’ through evaporation and transpiration from that area and may generate enough surplus to infiltrate the soil and fill the entire pore space in the soil mass, including unconfined aquifers/shallow ground water table.
- In the dry season, however, the river flows when the soil mass has free water, which naturally drains out. This happens when the water content in the soil is in excess of the maximum water-holding capacity or field capacity (= volume of water in saturated soil – gravitational water. This is the water that drains out). The rivers receive and drain out the gravitational water if the river bed is situated below the seepage line or upper line of saturation. Rivers cannot receive any seepage water from soil that has moisture below the field capacity and thus cannot flow through such soil-zones.
- The river has met the thirst of the people and the animals residing in its catchment.
- For local food and income security planning, apart from the above demand, it must also meet the requirement of water for crop production.
- There is provision to meet the demand of other production processes (for example, industry).
There may be other demands too; however, let us move with these minimum points.
Let us try to prepare a hypothetical hydrological balance sheet of a catchment.
Calculations (rephrasing the above in words):
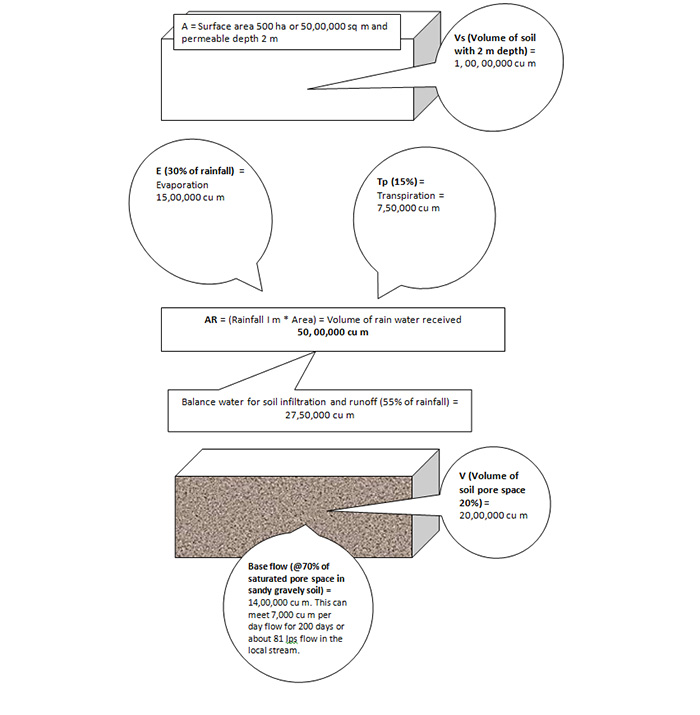
Supply:- Let us assume the catchment area of a river is A (in sq m) = 500 ha or 50,00,000 sq m
- So, volume of total rain water available in the catchment will be (= A* R); say it is AR = 50,00,000 * 1 = 50,00,000 cu m.
Demand:
- Let Annual evaporation demand is E (in metres), say 30% of rainfall or 0.3 m. This volume will be 15,00,000 cu m.
- Annual transpiration demand, other than from crop production is Tp (in metres) @ 15% of rainfall or 0.15 m or 7,50,000 cu m.
Thus, the water lost through E and Tp is 0.45 m (0.3 + 0.15) or in terms of volume it is 22,50,000 cu m. And water that might flow as runoff to the river + the water that might get absorbed in the soil is 55% (or 0.55 m) or 27,50,000 cu m.
Water holding capacity of soil: - Let us assume the permeable soil depth is D (in metres) is 2 m; the volume of the soil mass that will hold water is Vs (= A*D) in cu m or 50,00,000 * 2 or 1,00,00,000 cu m.
- Porosity is 20% (assuming soil is sandy mixed with gravelly texture) or 0.20 Vs. or 20,00,000 cu m
.
So, the demand for filling the pore space is 20,00,000 cu m.
Thus, if the total porosity of the soil mass of the entire catchment area is allowed to be filled and no other demand is made, out of 27,50,000 cu m only 7,50,000 (27,50,000 – 20,00,000) cu m of water will go to the river as runoff (if no additional water harvesting structures are made within the catchment area).
However, about 70% (range from 60 to 80%), that is, about 14,00,000 of 20,00,000 cu m of the water gets into the soil pore-spaces in sandy, gravelly soil) and will gradually move as seepage to the drainage point as base flow.
If we assume this, 14,00,000 cu m of water will flow through the 7 dry months (post rainy months from Nov to May), that is, about 200 days, it will have, on an average, 14,00,000/200 or 7,000 cu m flow per day. This can provide about 81 litres per sec flow rate for 200 days of dry period. This will only be possible when no one is using this base flow for other purposes.
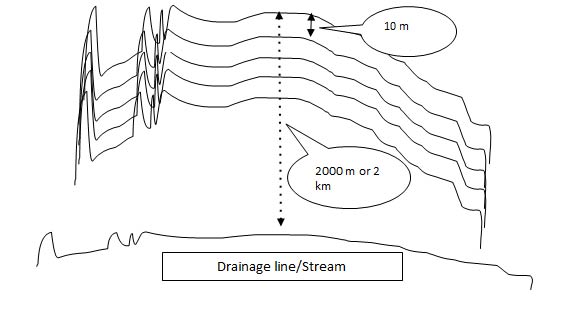
Hydraulic conductivity of the soil (sandy, gravelly texture) could vary from 5 (sandy soil) to 20 m per day. Let us assume, in this case this conductivity is 10 m per day.
This means, to have the base flow available to the stream at the end of 200 days, the farthest piece of land of 2.5 ha should be located at least 2,000 m (200 * 10) away and at a higher altitude with no barriers in the topographic sequences.
Let us look at the following sketch: Assume that the land between each successive two lines, spaced at 10 m distance, covers a narrow strip of land of about 2.5 ha. This means the entire 500 ha of catchment of the stream is divided into 200 such strips of land, located one after another in the topographic sequence.
Apart from water demand for the ecosystem, there are other demands also. These too need to be estimated to see if there is a possibility of surplus water to flow to river.
Additional water demand: - The water demand for farm-based livelihoods (food production of the population there) is F (population multiplied by per day per capita demand in cubic metres), if the population of the catchment is 1000. As per the estimation of WHO, the per capita annual water demand is about 1,700 cu m to ensure per capita demand of 30,000 kcal. Thus, the value of F will be 17,00,000 cu m.
- The water demand for Industry (manufacturing, service sector, food processing etc) is I (in cu m). Let us assume the demand from Industry and other sectors is 4,00,000 cu m.
The total additional demand (of people and their livelihoods + industry) is 21,00,000 (17,00,000 + 4,00,000) cu m.
If 21,00,000 cu m is taken out of 27,50,000 cu m in one go, the soil mass will receive a of maximum 6,50,000 cu m against its water-holding capacity of 20,00,000 cu m.
We know, however, that the water demand of the population is more or less uniformly distributed through the year and is generated on a day-to-day basis. To make the calculations easy, let us divide the year into three seasons, each of four months.
During the four rainy months (say July to October), only one-third of the total demand or 7,00,000 cu m of 21,00,000 cu m (Total additional water demand that is required to meet the life and livelihoods i.e. F + I) will be utilized, leaving a balance 20,50,000 cu m, to be absorbed by the soil mass of the entire catchment area. Let us assume, because it is the rainy season, that this is taken directly from the rain and not from the soil mass.
By the next four months (November to February), an additional 7,00,000 will be used by people, exhausting (un-saturating) the one-third thickness 2 m soil mass.
By the next four months (March to June), two-third of the saturated soil mass will be exhausted (get un-saturated), leaving only one-third of the soil mass saturated.
This means that by the end of the rainy season, the entire 1,00,00,000 cu m of the soil mass will yield seepage water due to hydraulic conductivity; by May, however, only one-third of the soil mass, or about 33,00,000 cu m soil mass, will contribute to seepage. Again, assuming that the soil texture is of the sandy, gravelly type, it has 20 per cent pore space, of which 60 per cent approximately will be gravitational water. This means about 3,96,000 cu m water will contribute to the base flow.
There are other complex phenomena. People start drawing water (from wells) for irrigation from about December. Till then, because of the natural hydraulic movement from October to December for about 60 to 100 days (depending on when they actually start drawing ground water), gravitational water has already travelled down the topo-sequence, that is, it has travelled about 0.6 km to 1 km downstream. Thus, by that time, water is available only in the downstream areas of the catchment within I km from the lowest part of the catchment.
In the case of more gravelly soil, hydraulic conductivity will be faster (could be 20 m a day) and the above calculations will accordingly change.
Let us build an alternative scenario (because the physical properties of the soil and other terrain features vary a lot).
| Soil Type | Unit in Litres (1000 l = 1 cu m) | Macro Porosity (in %) | Micro Porosity (in %) | Total Porosity Volume (in Litres) | Volume of Yield in Litres/Cubic Metre of Soil |
|---|---|---|---|---|---|
| Clay | 1 | 3 | 47 | 500 | 30 |
| Coarse Sandy | 1 | 22 | 3 | 250 | 220 |
| Coarse Sandy | 1 | 22 | 3 | 250 | 220 |
| Loam | 1 | These values will be somewhere between those two. | |||
Some research organization, somewhere in the world may have worked on and tested such an equation. I am not aware of it. My sincere request to readers of this article is to inform me about any such work done in our country. If not, we need to take up research projects on this. There has to be decentralised research across different river basins in different agro-climatic regions.
Let us assume a river has a catchment area of 1000 sq km or 100,000 ha and has been divided into 200 micro watersheds, each one of 500 ha. We need to plan for each of these 200 micro watersheds to ensure the visualized rejuvenated river. How should we approach to this? Here are some suggestive steps,
- We need to start with an estimate of what would be the desired additional water flow rate in the local river distributed across different months. To simplify, let us assume the flow rate in the driest month, say, May, is 2000 litres per second. And each micro watershed yields its proportionate share (with respect to the total river catchment area) to its area. For example, if the river flow rate is 2000 litres (or 2 cu m) per second, in this case, each of the 200 micro watersheds should yield/contribute a minimum (2000/200) of 10 litres of water per second.
- Let us also assume the monsoon withdraws by 15th of October and the base flow in the local stream continues till mid-May, roughly, 200 days. We can work out the flow volume for those dry months as shown in the following table.
- Let us assume the desired flow volume of 200 days per micro watershed (of 500 ha) is 200,000 cu m instead of 1,72,800 cu m. That means the per-day yield of that micro watershed should be 1000 cu m. Each hectare of land is expected to yield 2 cu m per day. One cubic metre equals to 1000 litres, so 2 cu m is 2,000 litres. These 2,000 litres are expected from the 10,000 sq m area. If those 10,000 sq m of land has a permeable soil depth of 2 m, each hectare of land has a soil mass of 20,000 cu m. Meaning 2000 litres of water per-day yield are expected from 20,000 cu m of soil. This is 0.1 litres/day per cubic metre of soil mass.
| Contribution of Each Watershed of 500 ha | |||||||
| Desired Additional Contribution to River Flow from each 500-ha area. | |||||||
| In Litres Per Second | Litres Per Day | Cubic Metre/day | % of Total River Flow Volume | Cubic Metre/Month | % of Total River Flow Volume | Cubic Metre/200 Days | % of Total River Flow Volume |
|---|---|---|---|---|---|---|---|
| 10 | 8,64,000 | 864 | 0.5 | 25,920 | 0.5 | 1,72,800 | 0.5 |
| Total desired additional river flow volume | |||||||
| 2000 | 172,800,000 | 172,800 | 100 | 5,184,000 | 100 | 34,560,000 | 100 |
Tasks to develop a model applicable to local context
- Study rainfall patterns of the last 30 years at the very least; look for the long-term cycle of wet and dry years.
- Assess the lowest, medium, and highest potential run-off and harvesting potential.
- Calculate the lowest possible unit wise (with feasible local governance system; that could be a village or gram panchayat) minimum and maximum availability of water harvested.
- See also the distribution of that volume in a different topo sequence.
- Assess the demand of water for sustenance of desired land use of different parcels of land in different topo sequence.
- Calculate the difference between projected water demand and available water (maximum and minimum annual rainfall minus evapo-transpiration).
- See if there is possibility of any excess water after meeting the projected water demand.
- The excess water needs to be conserved in the soil mass.
- Study the local river flow demand in the dry months (say, April or May). Assess and fix that value considering local outlet/s. Also, estimate what percentage of the catchment of that outlet is contributed by this unit. Assume that much of the percentage of flow volume is to be contributed by this unit.
- Locate the presence of impervious layer and its depth in the selected geographical area and calculate the volume of permeable soil mass that could be used for water conservation.
- Assume 20 per cent of the soil mass volume as pore space volume that can hold water and a fraction (could be 60 to 80 per cent in sandy gravelly soil but could be very low in clay soil; in clay soil, however, the porosity would be as high as 50 per cent or more) of any additional volume of water, absorbed in the soil, would get discharged as base flow in the post-rainy season. Consider the hydraulic conductivity suitable for local soil texture. This hydraulic conductivity is higher in coarse soil and decreases as silt and clay increases.
- Opt for a suitable water harvesting technique considering the local topographic and soil characteristics. Contour trenches, stone bunding along the contours, intensive hedge plantation on the contours, etc., are suitable activities on high slopes; 30–40 model (of in-situ rain water conservation, as developed by PRADAN) could be also tried with plantation. Farm ponds and field bunding would be appropriate at lower slopes. Gully plugs with loose boulders, along with treatment catchments, for in-situ conservation could be tried. All these need to be carefully designed with calculated accurately, to conserve the required volume of water. Structures such as check dams on the drainage lines/streams are inadvisable unless the entire catchment is treated, keeping the stream flow demand in mind.
Some References Used in This Theoretical Model
About the physical properties of the soil and its relationship with water holding capacity:
Now let us understand those physical properties of soil that influence the movement of water within it.
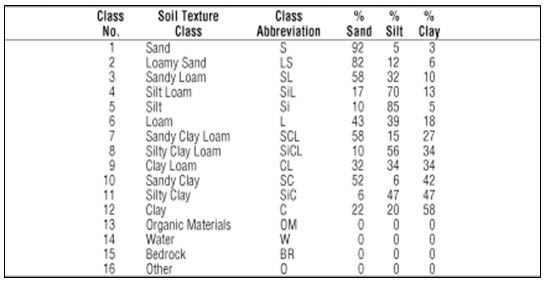
Let us also understand the range porosity of different soils responsible for water holding capacity.
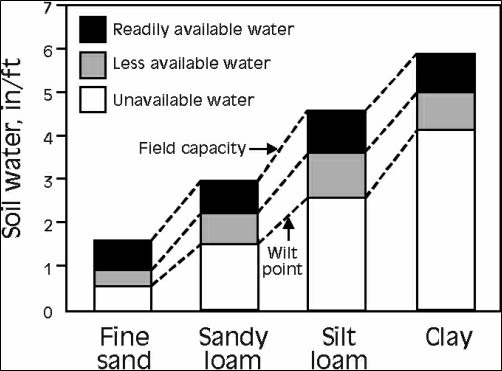
Source: Plant and Soil Science eLibrary
Calculating gravitational water from the above data.
| Soil Type | Total Water at Saturation (Inch/Foot) | Available Water to Plant (Inch/Foot) | Unavailable Water to Plant (Inch/Foot) | Gravitational Water that Drains Out | Soil Particle |
|---|---|---|---|---|---|
| Sand | 5.2 | 1 | 1.1 | 3.1 | 6.8 |
| % soil volume | 43.33 | 8.33 | 9.17 | 25.83 | 56.67 |
| % soil water | 100.00 | 19.23 | 21.15 | 59.62 | &npsp; |
| % soil water | 100.00 | 19.23 | 21.15 | 59.62 | &npsp; |
| Loam | 5.8 | 2 | 1.8 | 2 | 6.2 |
| % of soil volume | 48.33 | 16.6 | 15 | 16.6 | 51.67 |
| % of soil water | 100 | 34.48 | 31.034 | 34.48 | |
| Clay | 6.1 | 1.8 | 2.6 | 1.7 | 5.9 |
| % of soil volume | 50.83 | 15.00 | 21.67 | 14.17 | 49.17 |
| % of soil water | 100 | 29.51 | 42.62 | 27.87 |
K is Hydraulic Conductivity
| Value of K for | cm/sec | cm/hr | m/day |
|---|---|---|---|
| Silty loam | 0.00019 | 0.684 | 0.16416 |
| Loam | 0.00037 | 1.332 | 0.31968 |
| Fine sandy loam | 0.00052 | 1.872 | 0.44928 |
| Sandy loam | 0.00072 | 2.592 | 0.62208 |
| Loamy fine sand | 0.001 | 3.6 | 0.864 |
| Loamy sand | 0.0017 | 6.12 | 1.4688 |
| Loamy sand | 0.0058 | 20.88 | 5.0112 |
| Example Average permeability for different soil textures in cm/hour |
|
| Sand | cm/sec |
| Sandy loam | 2.5 |
| Loam | 1.3 |
| Clay Loam | 0.8 |
| Silty clay | 0.25 |
| Clay | 0.05 |
ABOUT THE AUTHOR
Dinabandhu Karmakar has been responsible for promoting Integrated Natural Resource Management (INRM) in different agro-climate zones in India and Africa. His innovations have been recognized as an approach to INRM that enhances local people’s livelihoods instead of focusing solely on conservation. He held leadership positions over 25 years in PRADAN, to promote locally appropriate activities to improve rural livelihoods. Currently, he is working as a freelance consultant.