Livelihood Analysis: The Case Of Jaalo Yadav
The analysis presented in this article is based on the information provided by Sachin Pathania in his documentation of the prosperity brought about in an impoverished family in southern Bihar through the introduction of tasar rearing activity in the village.
Introduction
W e have used the ‘risk-returns matrix’, frequently used by investors to balance their portfolio of investments. Poor households follow a similar behaviour when trying to balance their livelihoods portfolio. An assessment of the portfolio, over different points in time, makes it possible to see the movement, if any, over time. The effort of the household would be to move from a less desirable position on the matrix to a more desirable one (Figure 1). The movement can also be understood in terms of the efforts made to improve the net returns of various livelihood activities by trying to reduce the costs and/or increase the price realized or to improve productivity. Similarly, efforts to mitigate either production or the market risks would be reflected on the matrix.
The family largely depended on dry-land farming for subsistence. They owned 15 acres of land, of which only 1.5 bighas was productive; water was available only from the family well, that too in limited quantities, for critical support irrigation.
This analysis is complemented by corresponding changes in the asset base of the family.This is because the perception of risk is also affected by the strength of the asset base A mix of assets is drawn upon for various livelihood activities, which in turn yield streams of returns. Whereas these returns serve to meet consumption needs, the surplus, if invested in strengthening the asset base, makes the livelihood financially and environmentally more sustainable. This, in turn, makes the household feel less vulnerable because its ability to take shocks and stresses improves considerably.
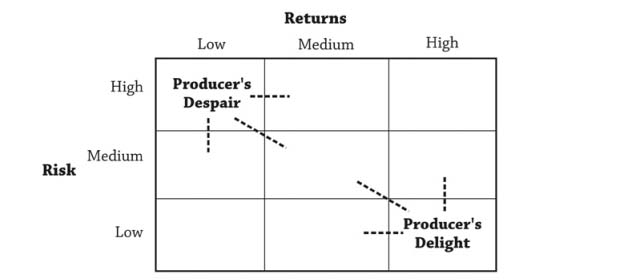
Figure 1: Risk-Returns Framework as Applicable to Livelihood Analysis
Situation Before The Intervention
I n 2001, the family relied on a cluster of six livelihood activities that mostly fell within the undesirable side of the Risk- Returns Matrix (Figure 2).
The family largely depended on dry-land farming for subsistence. They owned 15 acres of land, of which only 1.5 bighas was productive; water was available only from the family well, that too in limited quantities, for critical support irrigation. The food produced was barely enoughto feed the entire family of four sons, three daughters and aged parents. Productivity was low because the family did not have access to credit to spend on quality inputs. Risk was moderately high. Agriculture activity lasted for only six months in a year because only the kharif crop was cultivated.
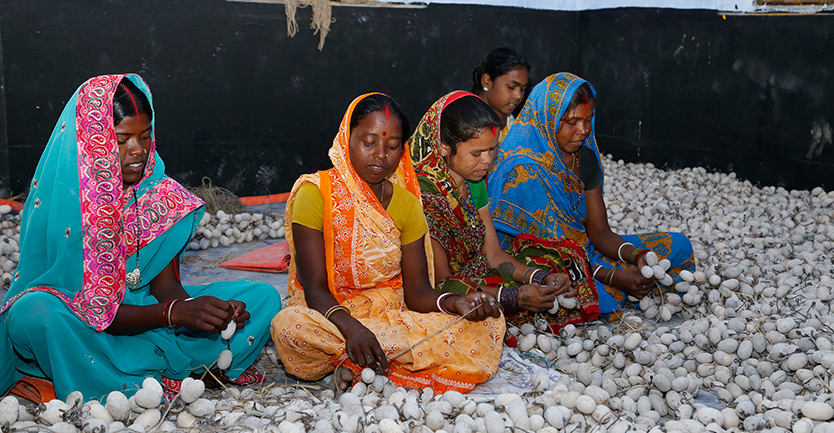
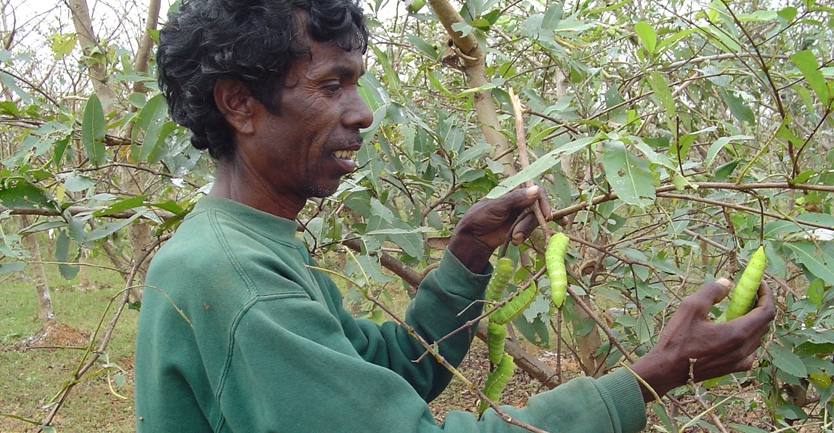
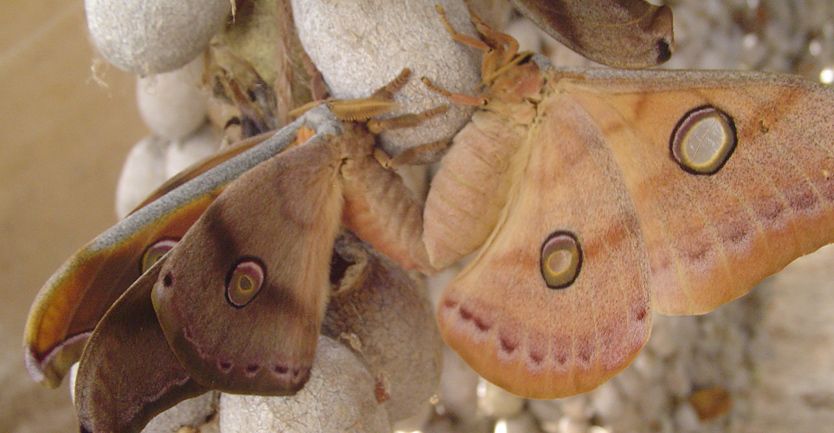
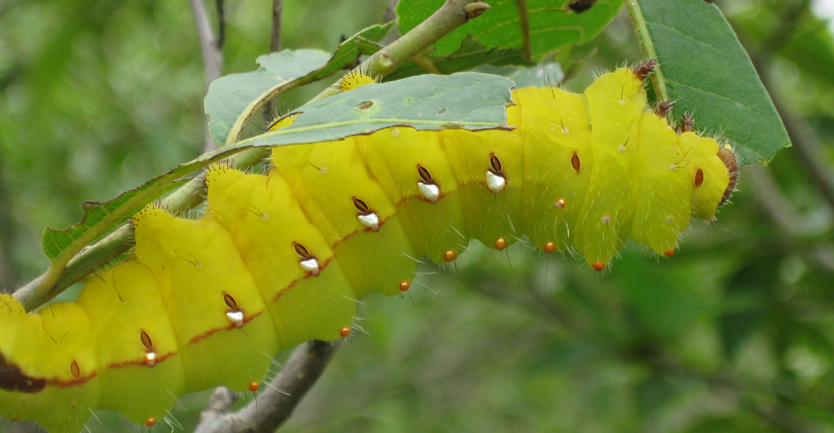
The family owned cattle, which included 15 cows, eight goats and a pair of oxen. The cattle provided milk, a good source of nutrition, and some milk was sold in the market. However, this benefit was there only for about eight months because during the summer the animals had to be sent away to a distant place owing to a shortage of drinking water and fodder in the village. Goats provided a good source of income but the risk of rearing them was very high on account of unknown diseases that struck at frequent intervals. Jaalo did not have access to modern veterinary services; the animals were, therefore, reared with traditional know-how. The family owned about 500 mahua trees, which was a blessing. These trees produced seasonal flowers and its seeds were collected and sold in the village. However,the price realized was very low. Jaalo also dabbled in silkworm rearing in the forest for three to four months of the year. The price paid by the traders for the cocoons was, however, very low, and once in four years the crop was more often than not, affected by disease. Yet, it was a source of income close to home. When no other source of earning was available, Jaalo and his brothers had to migrate to the nearby cities/villages in search of wage employment.
The quality of life was poor; often they could not afford even two square meals a day. They fell prey to vector-borne diseases such as malaria and dengue and bacterial diseases owing to lack of sanitation. There were times when they had to borrow money from the local moneylender at exorbitant rates of interest to meet their health-related expenses. Poor health also affected their ability to earn for the family.
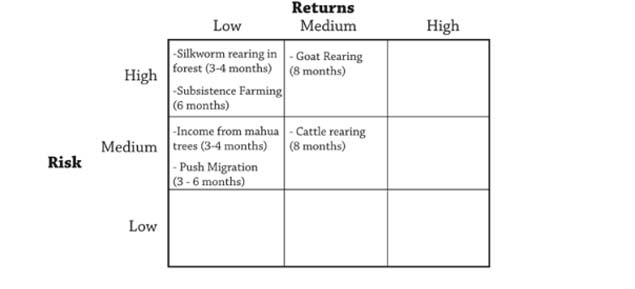
Figure 2: Jaalo Yadav’s Livelihood Portfolio in 2001
The Transition Years: 2002–12
By this time, his income, with six months of tasar activity in a year, increased to more than Rs one lakh. The risk had also gone down significantly because of the reliable seed produced at home.
A major transition took place in the livelihood of Jaalo Yadav and his family, as depicted in Figure 3.
The starting point was Jaalo’s involvement in scientific cocoon rearing under the guidance of PRADAN’s field staff. Within three to four years, he had started rearing seeds, moving the tasar activity into the medium-medium category of the RR matrix. Within four to five years, he had backward integrated by producing the nucleus seed as well. By this time, his income, with six months of tasar activity in a year, increased to more than Rs one lakh. The risk had also gone down significantly because of the reliable seed produced at home.However, a certain amount of risk was still involved in raising the cocoons in the forest because the larvae and the cocoons had to be protected from predators all the time. By the end of the decade, he had moved into the high returns-medium risk category.
The income from this anchor activity was used not only to improve the quality and quantity of food consumption and, therefore, the health of the family members but also to invest in agriculture and allied activities. Investment in a water pump, for instance, helped provide critical support irrigation to crops and drinking water to cattle so that they could stay home rather than migrate during the summer months. Jaalo was also able to purchase a bigha of productive land, which greatly contributed to their food security.
In the meantime, his three brothers, who earlier resorted to distress migration, now helped in the tasar activity for some of the time and only went out to earn better income (pull migration) in cities. With better social andnegotiation skills, we presume, Jaalo was able to procure better prices from traders outside for hismahua products as well. All these factors resulted in the entire livelihood portfolio moving towards the more favourable position on the RR matrix.
This improved position of livelihoods translated into a higher quality of life for the entire family; gainful employment, not only for the men but also for the women in the family; reduced vulnerability in livelihood activities and a stronger asset base. The family could move into a pukka (brick-walled) house from the earlier kuccha (mud-walled) house. In addition, they were able to purchase a flat for one of the sisters. Three sisters and two nieces could be married with considerable social expenditure. A motorbike was procured, which served as a useful asset to facilitate transport for livelihood and social occasions. After all the expenditure, they still had a reasonable saving of over Rs 1.7 lakhs in the post office and bank accounts.
More interestingly, when a major theft took place, the livelihood of the family was not affected much. Jaalo only had to defer the purchase of a tractor that he had been planning to buy for some time, to improve his agriculture practice further.
Plans For The Next Five Years
His self-esteem, as well as social standing, in the village has gone up. His expertise is recognized by others and he was invited by PRADAN to offer training in neighboring villages. He also began investing in his children’s education.
T he above transition was made possible because of Jaalo’s wisdom in making the right investments in strengthening agriculture and other livelihoods, leveraging the income gained from the anchor activity.
Eager to improve his position, he has drawn up plans for the next five years. These plans included expansion of the tasar cocoon further once the Asan trees planted by the Forest Department mature, and investing in water harvesting structures as well as a tractor to strengthen his agriculture. With improved social skills and social capital and awareness, he now also plans to get his animals vaccinated and invest in their sanitation and care so that they become more productive. The cumulative effect of all these measures, hopefully, will move many of his activities into the most desirable cell in the RR matrix. Figure 4 shows what the matrix could look like after another round of investments over the next five years.
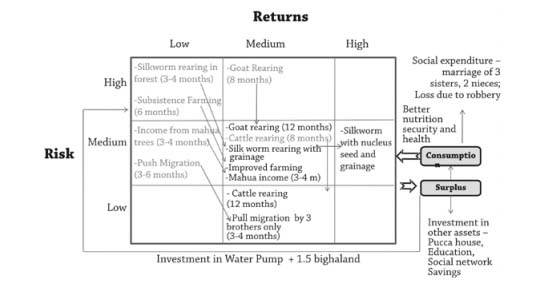
Figure 3: Transition in the Livelihood Portfolio during the Intervention Years
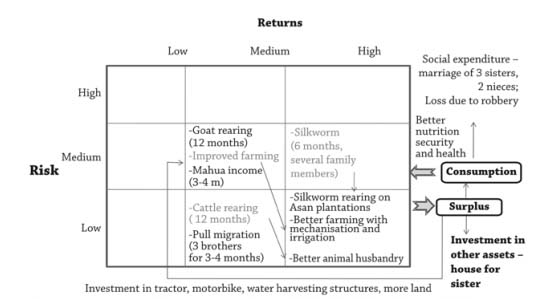
Figure 4: Expected Movement in Jaalo’s Livelihood Portfolio over the Next Five Years
Changes In Asset Base Representing Reduced Vulnerability
T he above analysis deals mainly with the income flow, although changes in the physical and natural asset base are indicated. The analysis can be complemented by a more thorough assessment of changes taking place in the asset base, using the DFID formulation of five types of assets (Table 1).
The above analysis can be shown graphically by plotting the changes in each asset type on a five point scale using the DFID Polygon (Figure 5).
Table 1: Changes in the Asset Base Using the DFID formulation
| No. | Asset type | Before | After |
|---|---|---|---|
| 1 | Natural |
|
Same as before except for productive land, which is also a type of natural capital (2.5 rating) |
| 2 | Physical |
|
|
| 3 | Human |
|
|
| 4 | Social |
|
|
| 5 | Financial |
|
|
Using The RR Framework For Continuous Improvement
The question then arises, what happens when a family reaches the most desirable position on the matrix over a period of time? Does it imply that there are no further risks to deal with, no further improvements in returns possible? Certainly not!
T he RR framework captures changes in risks and returns in relative terms. The reference point of returns for a particular family in a particular context will be the average returns of families surviving in that context. The reference point for risks of a particular livelihood will be the risks in similar livelihoods in the area. When improvements are assessed and documented, there are relative improvements over the starting point or the average for the region.
The question then arises, what happens when a family reaches the most desirable position on the matrix over a period of time? Does it imply that there are no further risks to deal with, no further improvements in returns possible? Certainly not! In the case of industry, the norm is continuous improvement through new technology, more efficient processes and systems, etc. The same is true for livelihoods of the poor. To assess continuous improvement, one can visualize cycles of improvement captured through consecutive RR matrices where in the end point of the first cycle becomes the beginning of the second and so on (Figure 6).
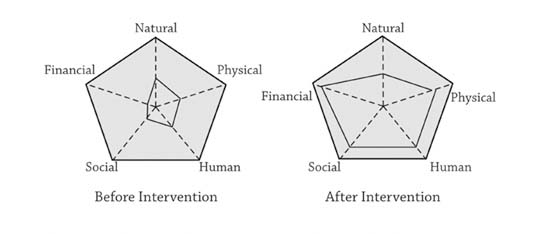
Figure 5: Changes in Asset Base: Before and After Intervention
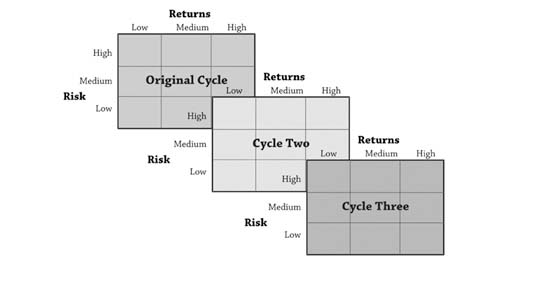
Figure 6: Capturing Cycles of Continuous Improvement
Astad Pastakia is a Development Consultant and is based in Ahmedabad, Gujarat